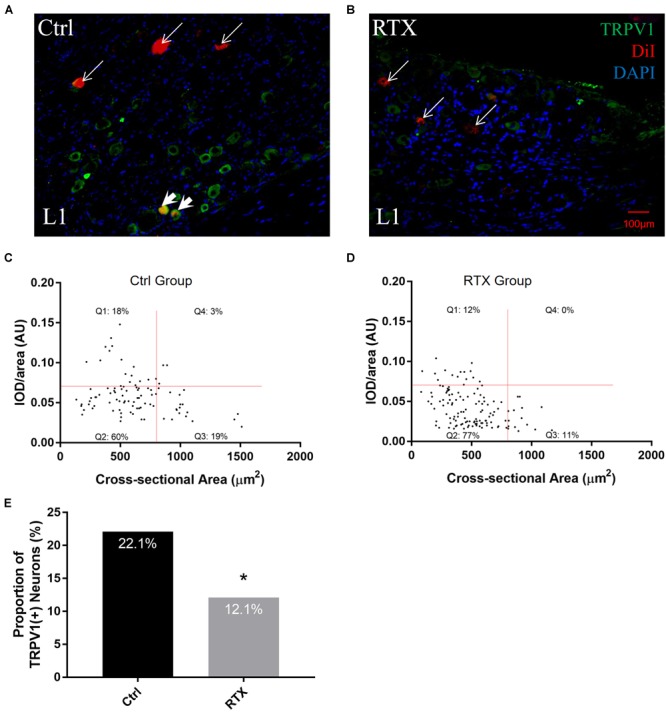
FIGURE 6.

Alterations in TRPV1 expression levels of PrAT-innervating sensory neurons following denervation with RTX. (A,B) Fluorescence images show a decrease in the number of TRPV1- and DiI-positive cells in the RTX group compared to the control group. (C–E) The scatter plot shows that the percentage of TRPV1-positive cells was reduced among DiI-positive cells.
