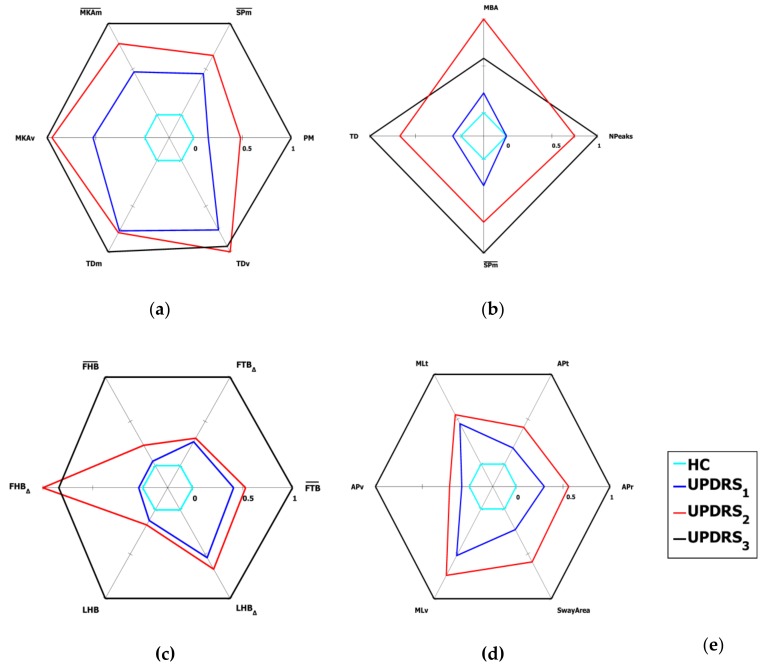
Figure 8.
Radar graphs of the mean values of the normalized kinematic parameters of HC and UPDRS severity classes for the lower limbs and postural tasks: (a) Leg Agility (LA); (b) Arising from Chair (AC); (c) Posture (Po); (d) Postural Instability (PSCOM); (e) Legend for the radar plots. See Section 5.3 for further details of the graph representation.

