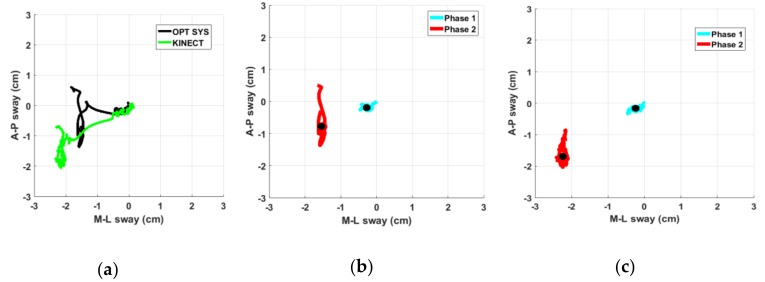
Figure 9.
(a) Example of CoM trajectory of a PD subject represented in the Antero-Posterior (AP) and Medio-Lateral (ML) components during the Po task, as measured by our system (green line) and by optoelectronic system (black line); (b) Details of the trajectories during the first (cyan line) and second phase (red line) of PSCOM task with the respective centroids (black dots) as measured by optoelectronic system; and (c) as measured at the same time by our system.

