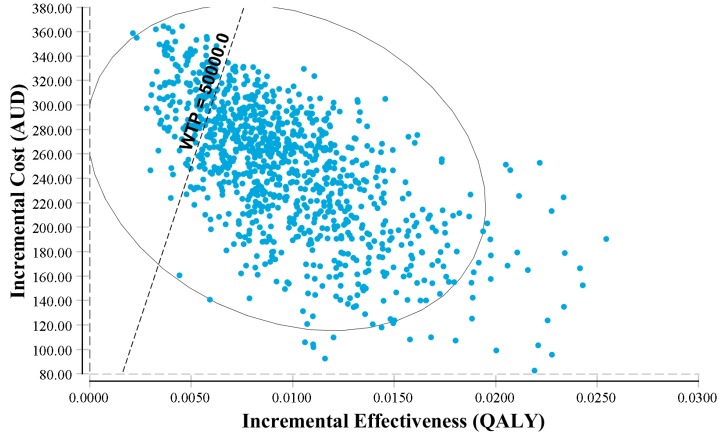
Figure 3.
Incremental cost-effectiveness plane. Note: QALY: quality-adjusted life year; WTP: willingness to pay; AUD: Australia dollar. The y-axis represents the incremental costs of proposed (with the workplace intervention for CVD prevention) vs. current scenarios (without the workplace intervention for CVD prevention); the x-axis presents the incremental QALY gains of the proposed vs. current scenarios. The workplace intervention has a probability of 85% being cost-effective.

