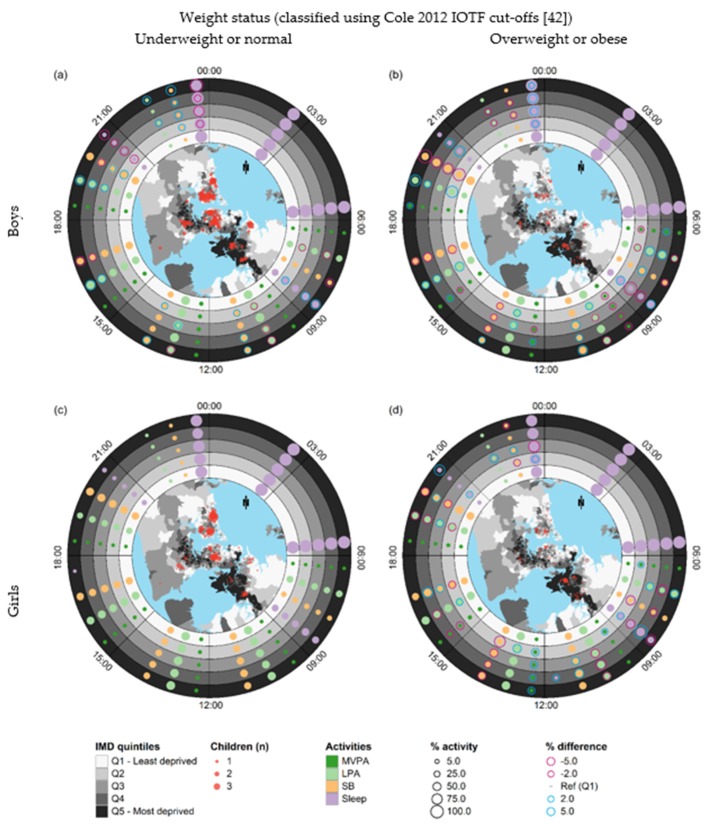
Figure 3.
Small-multiple ringmaps comparing time-use patterns on weekdays for children who regularly actively travelled to school in association with deprivation by sex and weight status: (a) boys with underweight or normal status; (b) boys with overweight or obese; (c) girls with underweight or normal status; (d) girls with overweight or obese status. The configuration of each ringmap is the same as the ringmap in Figure 2. Proportional circular outlines representing negative and positive differences in average percentage of time spent on each activity compared to the least deprived quintile (% difference = 0%) are overlaid. Percentages of less than 1% and differences in percentages between −2% and 2% are suppressed.

