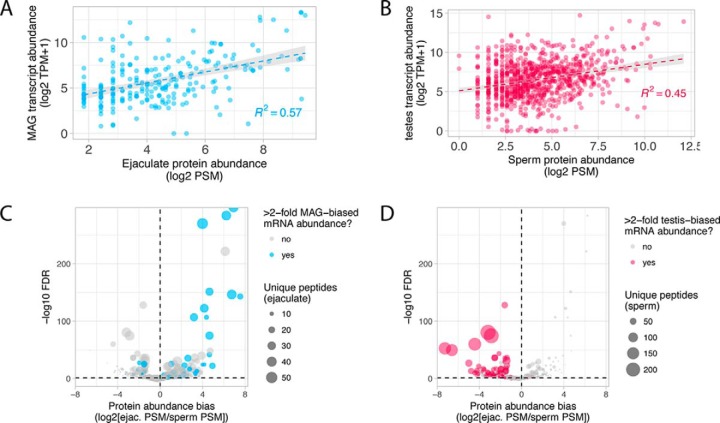
Fig. 2.
Protein and mRNA abundance relationships. (A,) and (B,) Scatterplots of normalized mRNA and protein abundance for MAG transcripts and ejaculate-specific proteins (A,) and testis transcripts and sperm proteins (B,). The line and gray shading represent a linear model fit with its 95% confidence interval respectively. Coefficients of determination (R2,) are indicated. (C,) and (D,) Volcano plots of protein abundance differences for all proteins detected in both the ejaculate and sperm samples. Proteins that show >2-fold mRNA expression-bias in MAG or testes tissue are indicated in blue (MAG-biased) or red (testes-biased), and the size of each point corresponds to the number of unique peptides detected for each protein.

