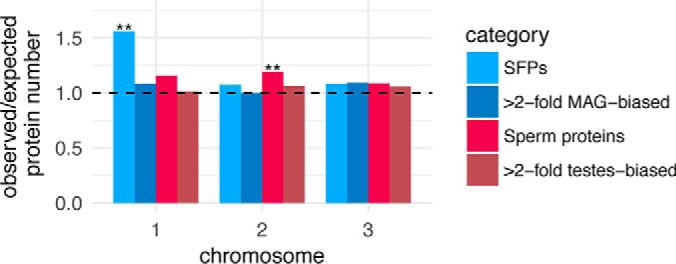
Fig. 4.

Chromosomal distribution of genes encoding SFPs, sperm proteins, or transcripts with MAG-biased expression or testis-biased expression. The y, axis represents the ratio of observed/expected number of genes for each of the chromosomes in Ae. aegypti,, and the dashed line represents the expectation under no enrichment/depletion. Asterisks indicate significant enrichment (Chi-square; **p, < 0.01).
