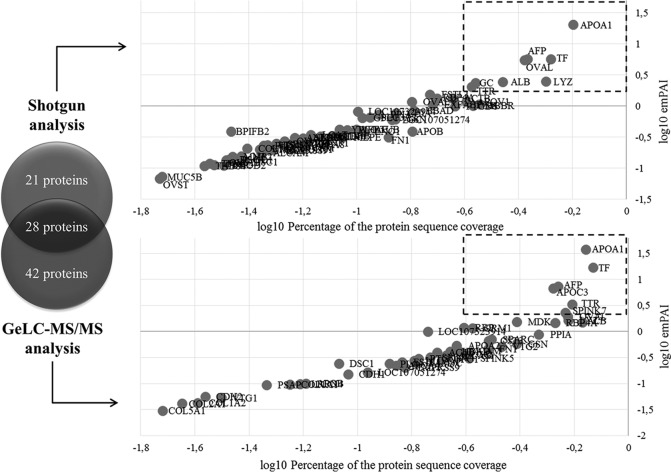
Fig. 4.
Quantitative distribution of the 91 proteins identified in the chicken amniotic fluid at ED11, for shotgun and GeLC-MS/MS mass spectrometry analyses. Proteins are represented according to log10 of their Exponentially Modified Protein Abundance Index (emPAI) and log10 of the percentage of their protein sequence coverage. The most abundant proteins identified after compilation of data resulting from both approaches are illustrated in a dotted square. They were further analyzed for functional annotation as shown in Table I.

