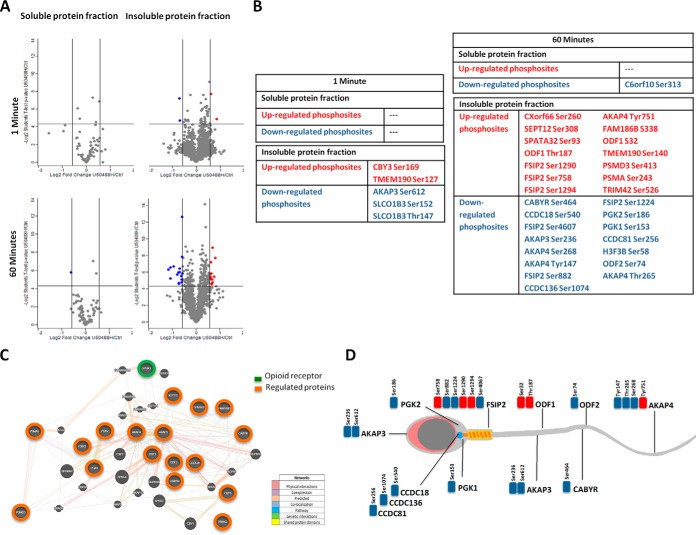
Fig. 2.
Effect of U50488H in the human sperm phosphoproteome. A,, Overall Log2 U50488H/Control TMT fold change as a function of -Log2 statistical significance of U50488H/Control (p, value < 0.05) of the soluble and insoluble protein fractions after 1 and 60 min U50488H treatment. In blue are indicated the down-regulated phosphosites by U50488H. In red are represented the U50488H-up-regulated phosphosites. B,, Tables containing the U50488H-regulated phosphosites following 1 and 60 min treatment in the soluble and insoluble protein fractions. U50488H/Ctrl > 1.5 in red and U50488H/Ctrl < 0.67 in blue. C,, Representation of a working model of the protein interactions belonging to the U50488H-regulated phosphosites. KOR is represented in green color whereas the proteins belonging to the U50488H-regulated phosphosites are colored in orange. The showing model has been constructed based on GENEMANIA (http://genemania.org/) the interactive functional association network tool. D,, Illustration gathering the localization of the proteins belonging to the U50488H-regulated phosphosites within the human spermatozoa. The downregulated phoshosites are represented in blue whereas the up-regulated ones are colorized in red.

