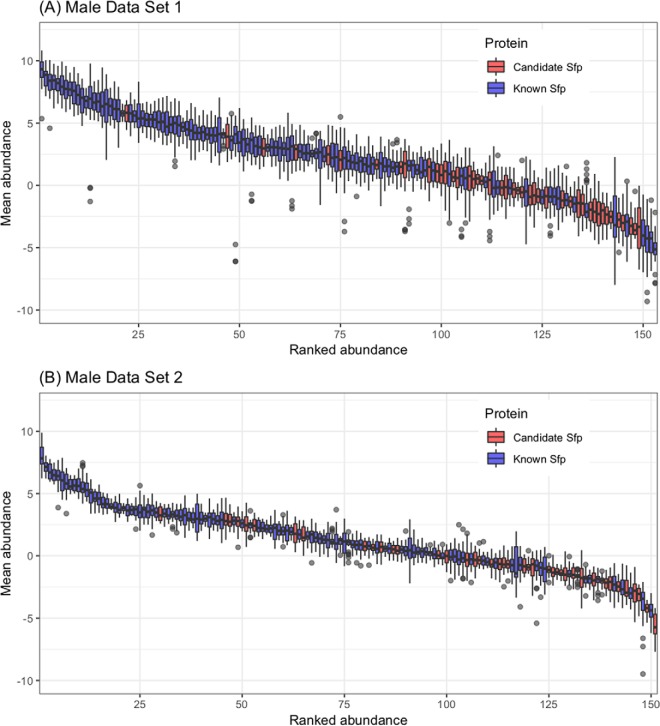
Fig. 4.
Boxplot of the relative abundance of known Sfps and candidate Sfps found in (A,) Male Data Set 1 and (B,) Male Data Set 2. Protein abundances were averaged across all the samples in the experiment and were sorted by decreasing order. Known Sfps are colored in blue and candidate Sfps are colored in red.

