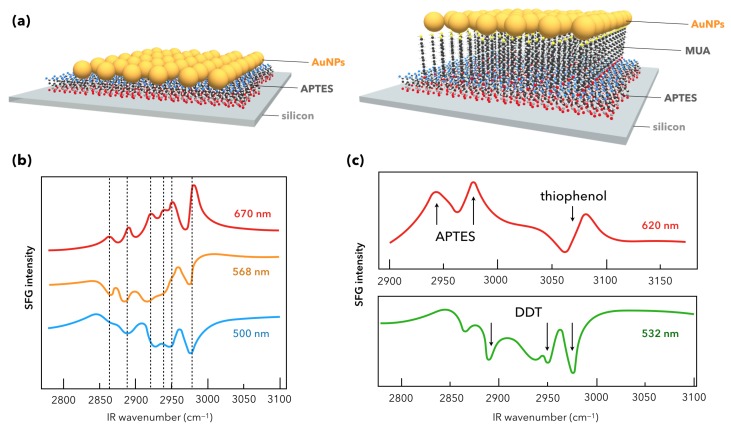
Figure 10.
(a) AuNPs/APTES/Si (or AuNPs/MUA/APTES/Si) interfaces before functionalization with thiophenol or dodecanethiol (DDT). (b) 2C-SFG spectra of the AuNPs/APTES/Si interfaces for three different incident visible wavelengths from blue to red as indicated on the picture. The complete shape-reversal of the APTES vibrational signature between the blue and red curves is well marked. (c) SFG spectra for specific incident wavelength revealing the vibrational fingerprint of thiophenol (top) or DDT molecules (bottom) chemically adsorbed on two different AuNPs/APTES/Si interfaces, respectively. Figure panel is adapted from reference [34].

