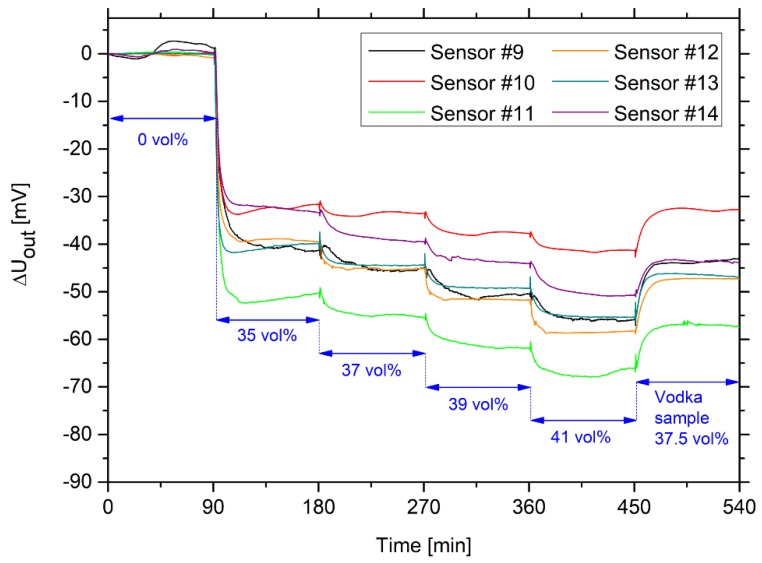
Figure 7.
Time-dependent change in output voltage for six hydrogel-based sensors in ethanol–water mixtures with defined ethanol concentrations (between 35 and 41 vol% ethanol) for the preparation of calibration curves. At the end of the experiment, a vodka sample (“Wodka Gorbatschow” with 37.5 vol% ethanol) was measured to calculate the ethanol concentration of the vodka using the calibration curves.

