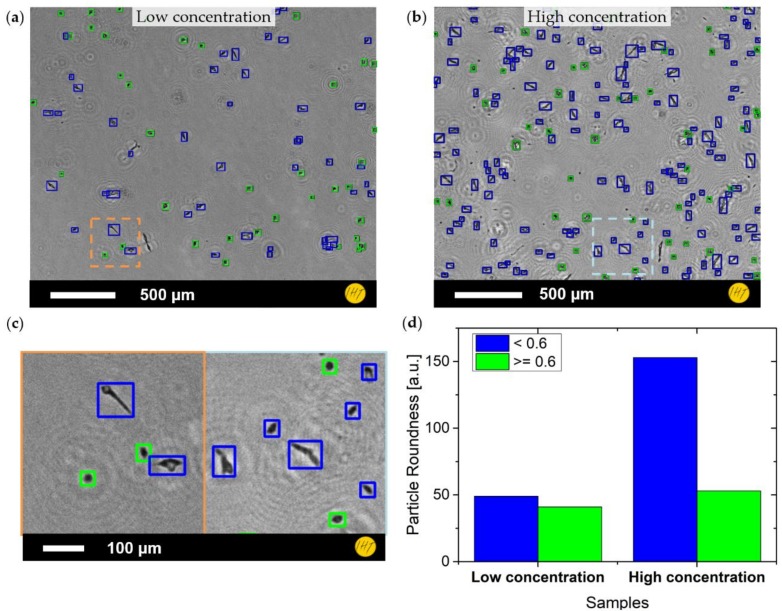
Figure 5.
Cell registration of neuroblastoma cultures: (a) amplitude image of low concentration cell culture with cell findings overlay (blue for low roundness, green for high roundness); (b) amplitude image of high concentration cell culture with cell findings overlay (colors as in (a)); (c) zoomed-in images (orange and light blue square) showing the distinction between the two cell types; and (d) histogram of counts shown in (a,b) (matching colors).

