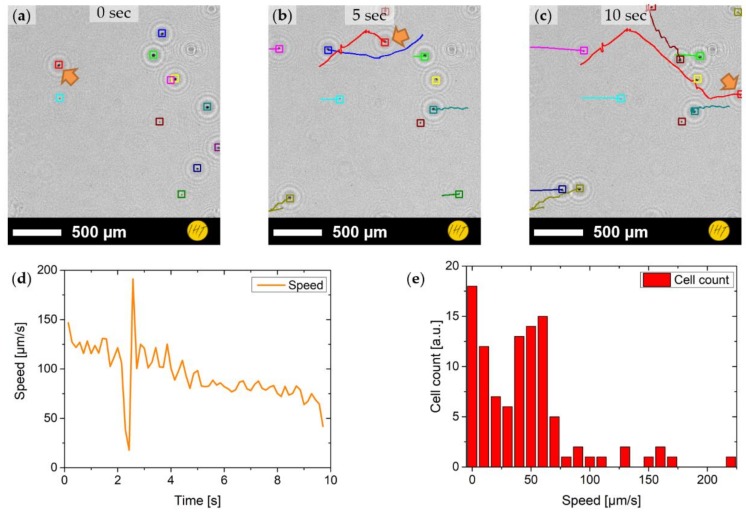
Figure 8.
Cell tracking of P. minimum cells on a microscopy carrier: (a–c) tracking results from the start of the measurement (0 s) to 10 s with marked cell positions and trajectories; (d) extracted momentary speed of one cell trajectory (orange arrow in a–c); and (e) average speed distribution of all cells.

