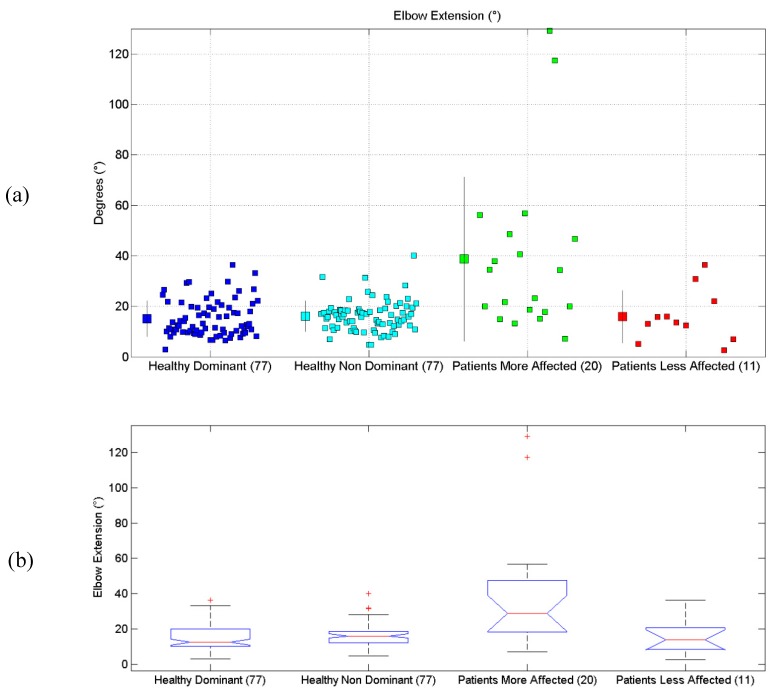
Figure 6.
(a) Scatterplot for Elbow Extension Angle for the four considered groups. Mean (SD) of each population (considered limb) are reported. (b) Distributions of Elbow Extension Angle, are shown for the four experimental conditions. The central line indicates the median, while the lower and upper extremities of the boxes represent the 25th and 75th percentiles, respectively. The whiskers comprise all the data points distribution except the outliers, which are plotted separately using the ‘+’ mark.

