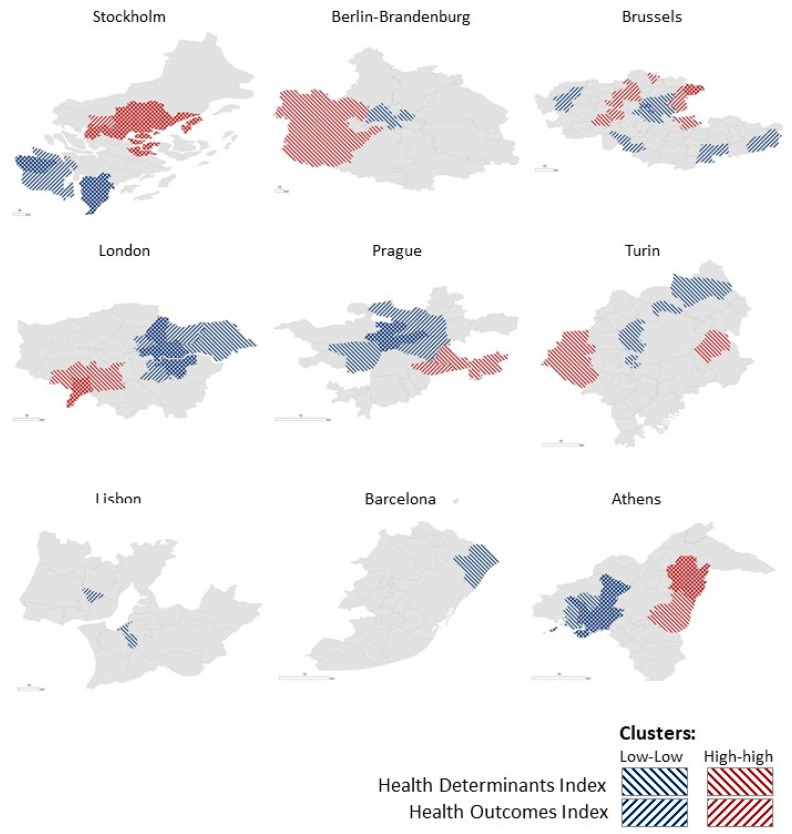
Figure 4.
Clusters of municipalities within the Health Determinants and the Health Outcomes Indices. Note: The figure represents the clusters identified for both the Health Determinants Index (backward diagonal shading) and the Health Outcomes Index (forward diagonal shading). Blue lines represent the municipalities with low value-scores that are surrounded by municipalities also with low value-scores (cluster Low-Low). Red lines represent the municipalities with high value-scores that are surrounded by municipalities which also register high value-scores (cluster High-High).

