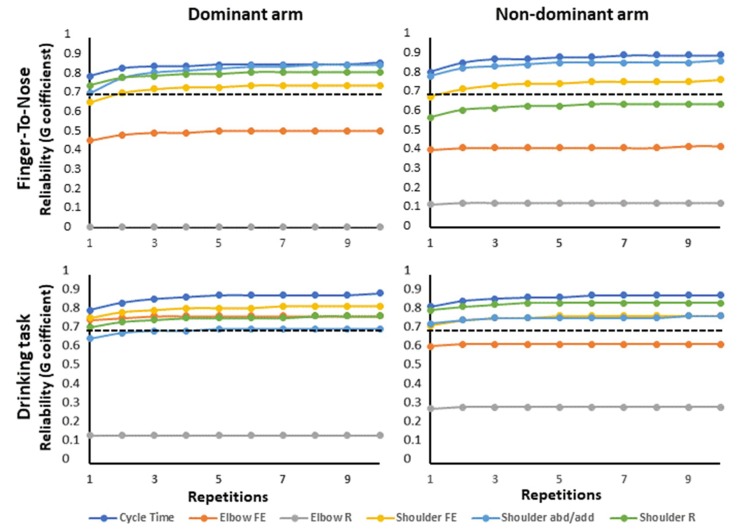
Figure 6.
Illustrates the overall reliability (i.e., G-coefficient) estimated with a different number of repetitions for the finger-to-nose and drinking tasks based on one single rater. The results are subdivided into dominant arm (left) and non-dominant arm (right) for the different outcome measures. The dotted line marks the level for acceptable reliability, G = 0.7.

