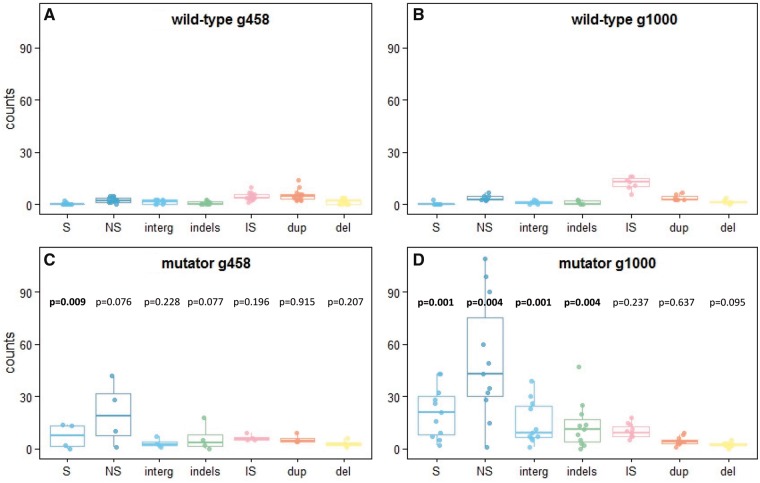
Fig. 1.
—Mutation spectra in evolved populations. Number of events for different mutation types per population, at generations 458 (A, C) and 1,000 (B, D) for wild-type (A, B) and mutator (C, D) populations. In blue, SNP (“S,” synonymous; “NS,” nonsynonymous; and “interg,” intergenic); in green, small insertions and deletions (<30 bp); in pink, insertion sequences; in orange, duplications; and in yellow, deletions. The bar depict the median, boxplots show first and third quartiles, and whiskers span the 95%. P values correspond to Mann–Whitney tests comparing the number of same type mutations in wild-type and mutator populations for a same generation.

