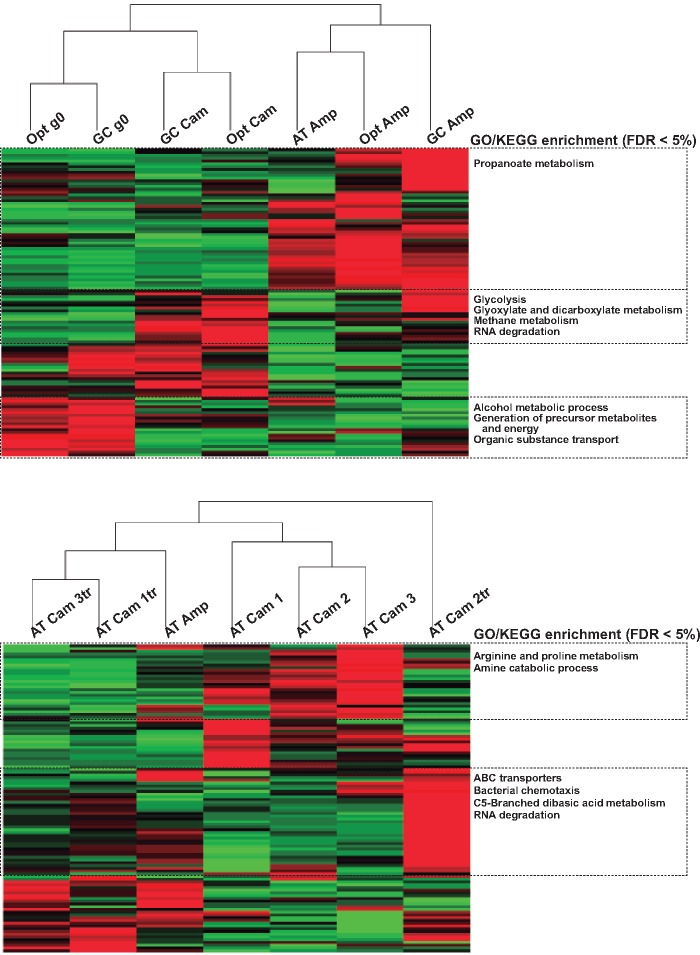
Fig. 4.
—Comparative proteomics and unsupervised clustering of the proteome profiles in bacterial populations. For both analyses, the AT-cat generation zero bacteria served as reference for protein levels. Each horizontal line within a red-to-green gradient reflects the lower-to-higher levels of an individual protein. In the right boxes, enriched functional categories in either the KEGG and in the GO repositories are given for horizontal clusters. (A) Comparison of ancestral populations and evolved populations. Populations have been pooled within gene version × antibiotic of selection combination (bacterial lines carrying the AT-cat gene were not included because of methodological constrains). (B) For bacterial lines carrying the AT-cat gene, comparison of evolved population under ampicillin (Amp) or chloramphenicol (Cam) with ancestral bacteria transformed with plasmids extracted from the evolved populations (labeled as “tr”).

