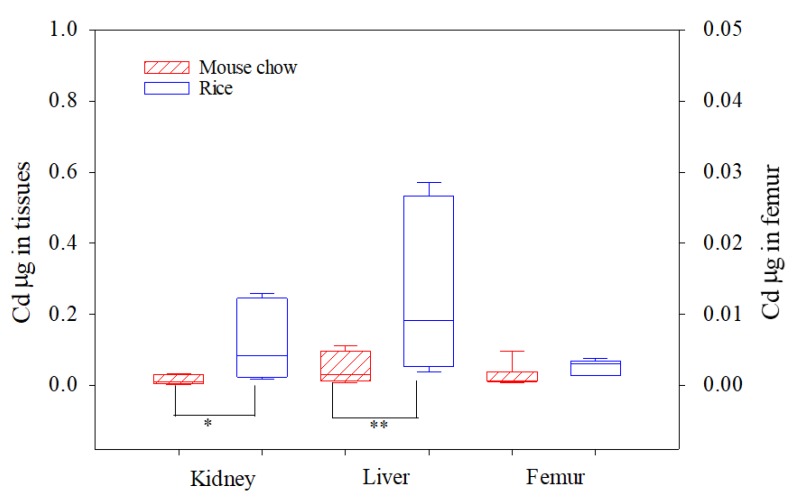
Figure 2.
Absorption of Cd (µg) per mouse kidney, liver, and femur after 10 days of Cd exposure. Significant differences between chow and rice groups (* p < 0.05, ** p < 0.01) based on ANOVA and Tukey’s honestly significant difference (HSD) tests. Please note the different scale for the femur Cd values.

