


Figure 2.
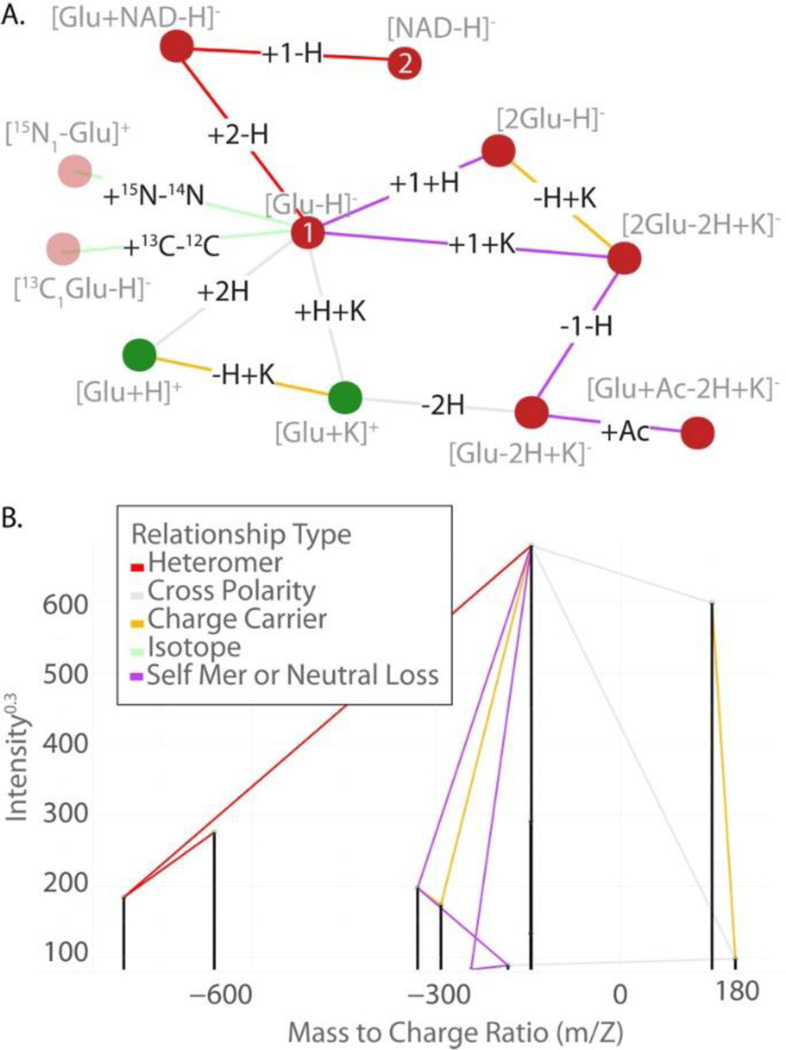
(A) Output of mz.unity represented as a graph structure. Edges represent peak relationships. (B) The modification relating the peaks is noted as text on each edge..Nodes represent detected m/z peaks. (C) The identity of each is noted with gray text by each node. Nodes are colored by polarity: positive (green) (D) and negative (red) Edges are colored by relationship type: charge carrier (yellow), cross-polarity (gray), (E) self-mer (purple), isotopic (green) and heterometer (red) (B) The graph structure in panel A superimposed on (F) the mass spectrum of the relevant peaks. Intensity in this graph is scaled as /0.3 so that the small peaks are visible.