
FIGURE 2. Different Contributions of Dependence on the Five Substances Studied to the Association of Lower Volume or Thickness With Substance Dependencea.
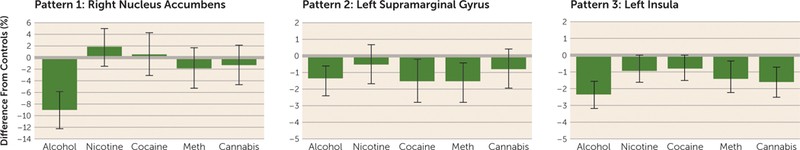
a For illustration purposes, both halves of the data (serving as the discovery and replication datasets) have been combined in the bar graphs. Three different patterns are illustrated. In pattern 1 (substance-specific effect), lower volume in the right nucleus accumbens was largely accounted for by dependence on alcohol alone. In pattern 2 (substance-general effect), volume in the left supramarginal gyrus was significantly lower in dependent compared with nondependent individuals (model 1) but was not significantly lower in any one particular substance group (model 2) compared with control subjects. In pattern 3 (substance-general effect), volume in the left insula was lower when either the alcohol-dependent group or the linear contrast of all substance groups except alcohol was compared with nondependent control subjects. Bars represent estimated marginal means expressed as percent difference from mean volume or thickness in nondependent control subjects. Error bars represent standard error. Meth=methamphetamine.