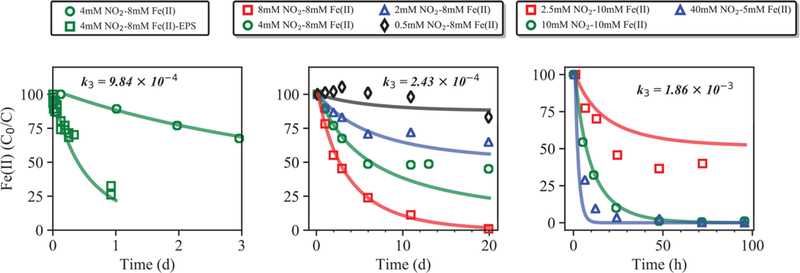
Figure 1.

Chemodenitrification rates for experiments by Klueglein et al.17 (left); Klueglein and Kappler16 (middle); Jones et al.25 (right) (used in simulations S1a, S1b, and S1c, respectively). Experiment 4 mM NO2—8 mM Fe(II) is replotted on the left panel with 4 mM NO2—8 mM Fe(II)-EPS for reference. Chemodenitrification kinetics were described using eq 14. Observed Fe(II) concentrations are presented as a percentage of initial concentration (C/C0).
