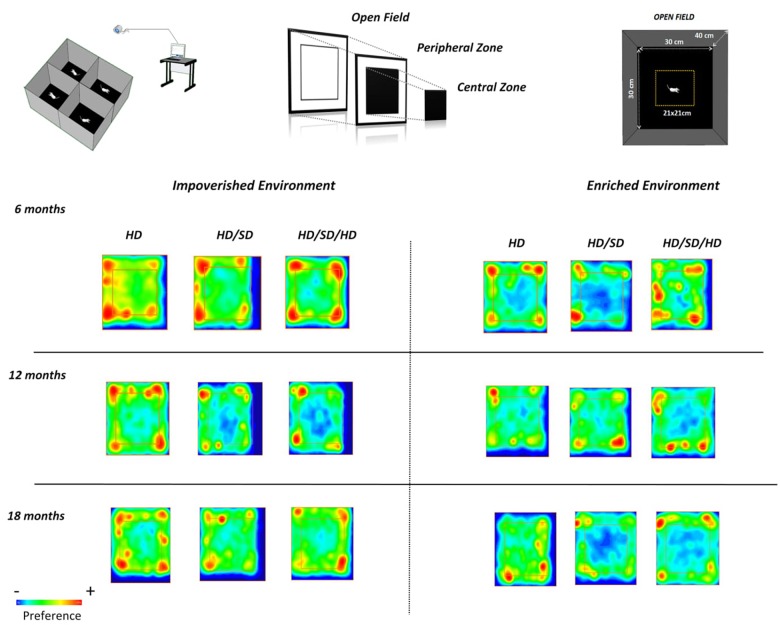
FIGURE 4.
Graphic representations of preferred areas in the OF test. (Top row, left) Experimental setup and video capture system for recording mouse behavior in the OF test; (top middle and right) the peripheral and central regions are equal in area. (Lower panels) Time spent in all areas by mice raised in impoverished (left) or enriched (right) environments, at different ages (rows). The square region more central (internal) delineates the central (external) and peripheral areas of the OF. Red, yellow, and blue indicate high, intermediate, and low preferences, respectively. Diet regimes are indicated at the top: HD = hard diet; HD/SD = hard diet followed by soft diet; HD/SD/HD = hard diet followed by soft diet followed by hard diet.

