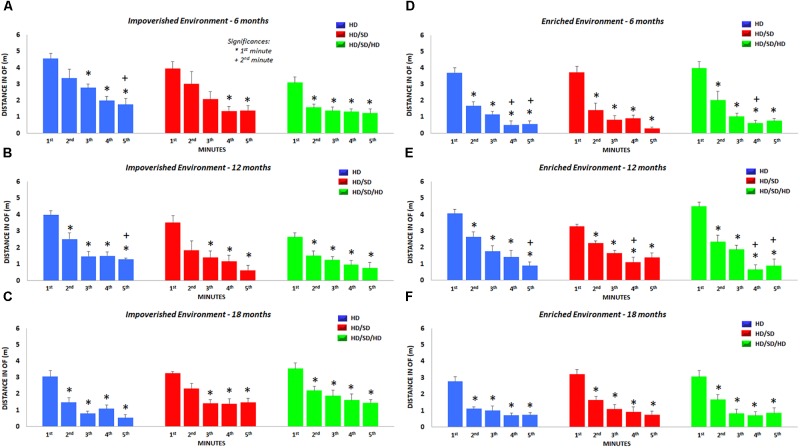
FIGURE 5.
Distance traveled in the OF test. Total distance per minute traveled during the OF test is shown for each diet regime (color-coded), age (top row: 6M, middle row: 12M, and bottom row: 18M), and environment (left: impoverished and right: enriched environment). (∗) Significantly different from the 1st minute; (+) significantly different from the 2nd minute; HD (blue) = hard diet; HD/SD (red) = hard diet followed by soft diet; HD/SD/HD (green) = hard diet followed by soft diet followed by hard diet.

