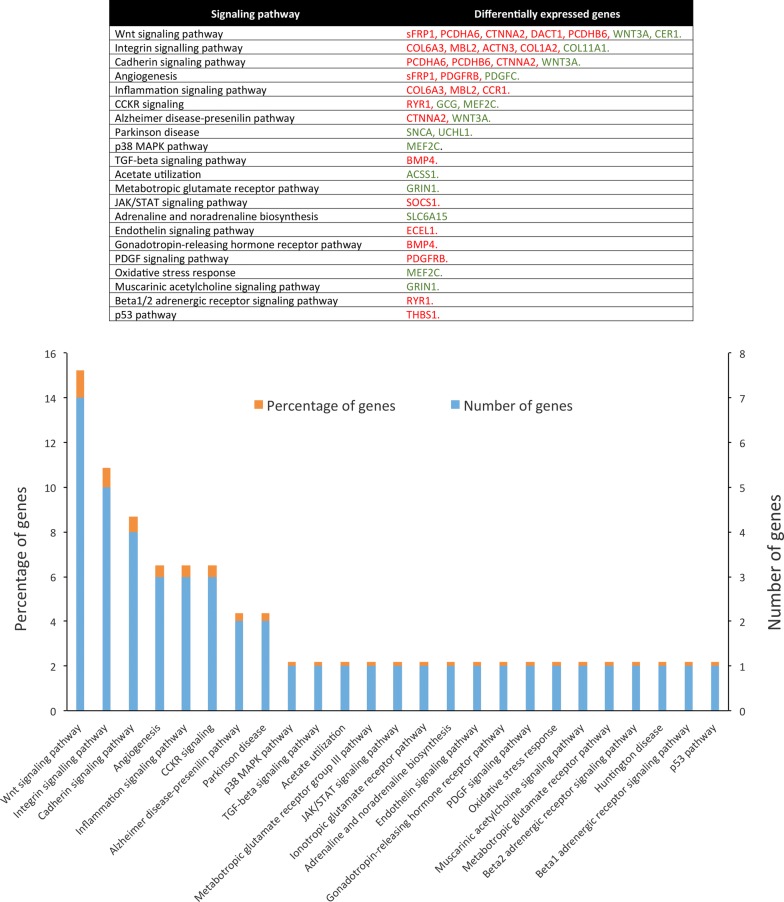
Fig. 6.
Molecular pathways analysis of DEGs. The table shows the signaling pathways deregulated in CBDCA-R-A2780 and their associated DEGs. In the graph, the vertical axes show the percentage of genes (orange) and number of genes (blue) annotated for each signaling pathway. Horizontal axis shows the name of the 21 deregulated metabolic pathways

