Fig. 3.

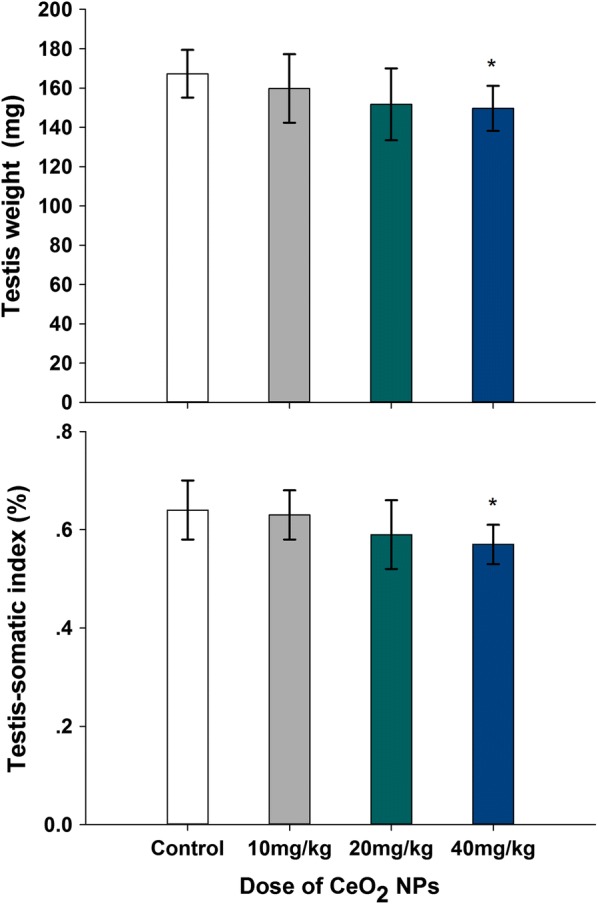
Effects of CeO2 NPs on testicular weight in mice following the addition of various doses of CeO2 NPs for 32 days. Values are mean ± SD, n = 12. Significance of difference: CeO2 NPs group compared with control, *p < 0.05

Effects of CeO2 NPs on testicular weight in mice following the addition of various doses of CeO2 NPs for 32 days. Values are mean ± SD, n = 12. Significance of difference: CeO2 NPs group compared with control, *p < 0.05