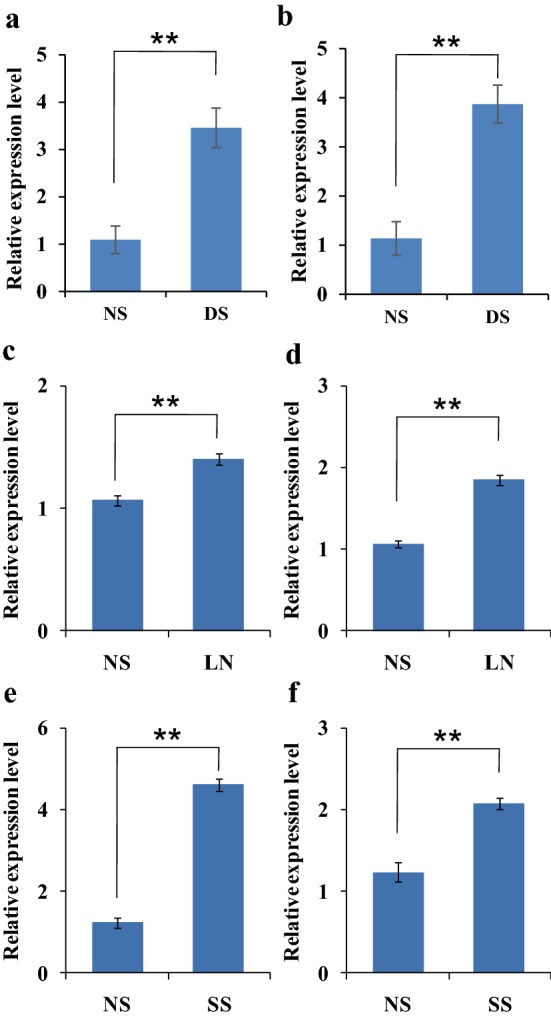
Fig. 1.

Relative expression level of TaH2B-7D under drought stress, low nitrogen and salt stress conditions. a, b drought stress; c, d low nitrogen stress; e, f salt stress. a, c, e Real-time PCR analysis of TaH2B-7D using TaActin as reference gene. b, d, f Real-time PCR analysis of TaH2B-7D using TaActin as reference gene. NS non-stress; DS drought stress; LN low nitrogen; SS salt stress. Each bar shows the mean ± standard errors (SE). Double asterisk indicate significant differences at P ≤ 0.01 levels
