Fig. 2.
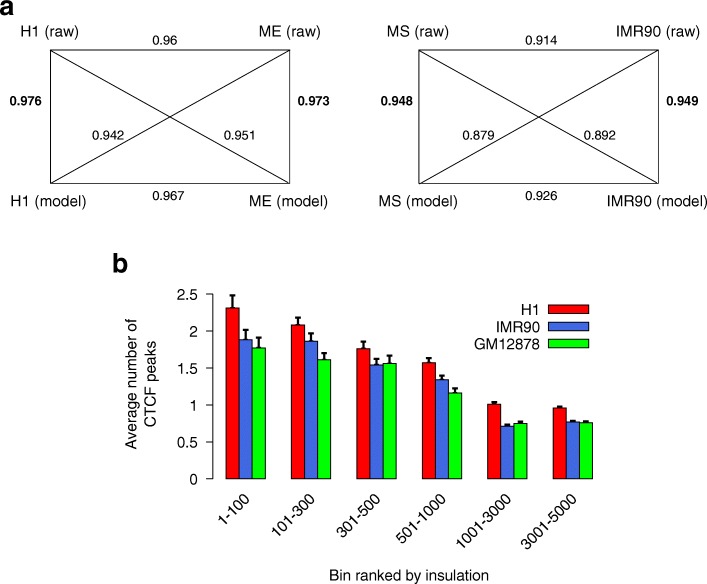
Validation of our model. a Comparison between our modeled Hi-C matrices and raw Hi-C matrices between closely related cell types; the numbers on edges represent the SCC score (from HiCRep [50]). b Enrichment of CTCF at bins that have a high insulation predicted by our model from Hi-C datasets [49]. In both a and b, Hi-C data is of chromosome 1

