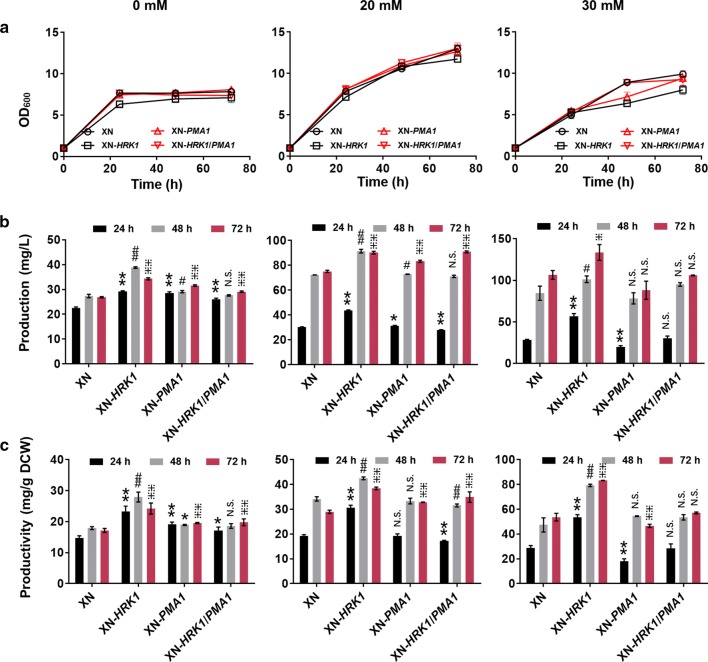
Fig. 3.
Overexpression of HRK1 and PMA1 for 6-MSA biosynthesis. Cell growth (a), 6-MSA production (b) and 6-MSA productivity (c) of recombinant strains XN, XN-HRK1, XN-PMA1 and XN-HRK1/PMA1 in medium with acetate of 0, 20 and 30 mM, respectively. Cells were cultured in YND medium supplemented with 0, 20 or 30 mM acetate (medium pH 4.5) at an initial OD600 of 1.0. Then 0.5% (w/v) glucose and acetate with defined levels (20 or 30 mM) were fed every 24 h. Acetate concentrations were marked on top of the figure. Each acetate level was for the group of vertical sub-figures. Statistical significance of 6-MSA production and productivity by overexpression of HRK1, PMA1, HRK1/PMA1 relative to the parent strain of XN at each time point is also shown. **P < 0.01, *P < 0.05 at 24 h; ##P < 0.01, #P < 0.05 at 48 h; ⁜⁜P < 0.01, ⁜P < 0.05 at 72 h; N.S., not significance. n = 6 for each strain at specific time points. The error bars represent the standard deviation of three biological replicates assayed in duplicate

