
Fig. 2.
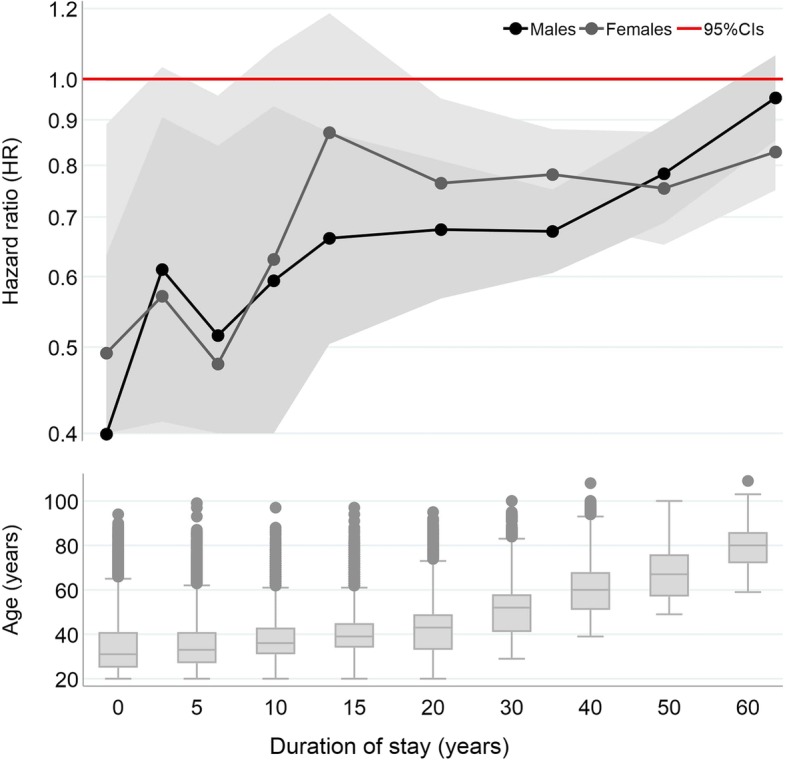
Hazard ratios (log) for all-cause mortality among male and female migrants over duration of stay, combined with box plots of age for each duration category, ages 20+. Survival analyses adjusted for age, baseline year of entry, education level, and marital status. See Tables S1 and S2 of Additional file 1 for regression tables