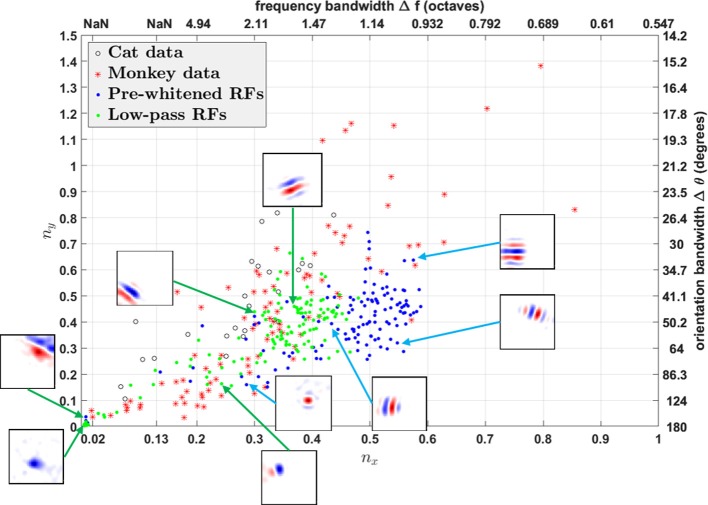
Figure 12.
nx vs. ny. Comparison of RFs of the model with experimentally recorded data for cat simple cells and monkey simple cells. Open circles: 25 cat simple cells from Table 1 in Jones and Palmer (1987a) re-plotted in the (nx, ny) plane; red stars: 93 monkey simple cells in Ringach (2002); blue dots: pre-whitened RFs using the pre-whitening filter described in Equation (9); green dots: low-pass RFs using the low-pass filter described in Equation (11). The axes on the top and right represent frequency and orientation bandwidths of fitted Gabor functions computed using Equation (19). Some examples of RFs are displayed in the inset sub-plots. Data points of estimated RFs with fitting errors > 40% were excluded, which gave 124 data points for pre-whitened RFs and 140 data points for low-pass RFs.

