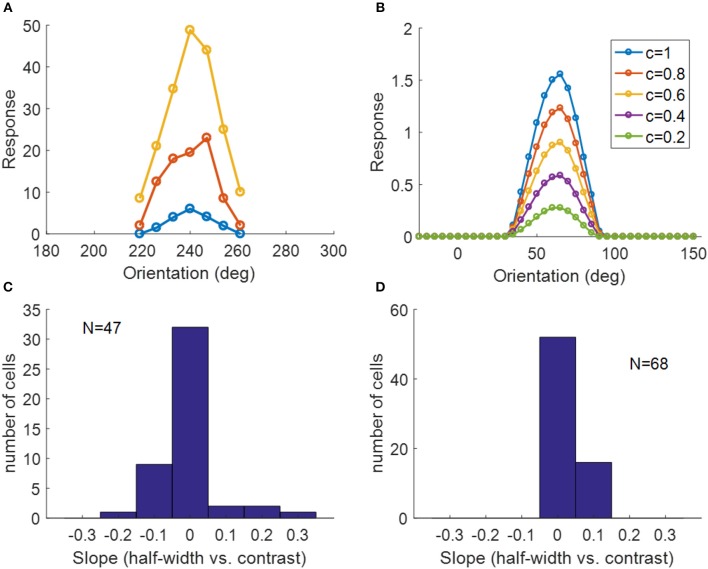
Figure 13.
Contrast invariance of orientation tuning. (A) Contrast invariant orientation tuning curves of a simple cell in cat V1. Re-plotted from Figure 3A in Skottun et al. (1987). Different colors represent different contrasts. (B) Contrast invariant orientation tuning curves of a cell in our model. c = 1 and c = 0.2 correspond to the high and low contrast, respectively. (C) Histogram of the slope of half-height bandwidth vs. contrast for V1 population in ferret. Re-plotted from Figure 3B in Alitto and Usrey (2004). (D) Histogram of the slope of half-height bandwidth vs. contrast for model simple cells.

