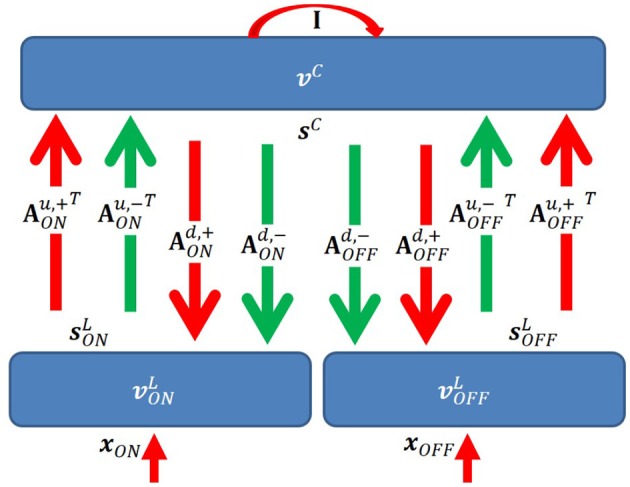
Figure 3.

Graphical representation of the model. I is the identity matrix that represents self-excitation. Red and green arrows represent excitatory and inhibitory connections, respectively. Upward and downward arrows are for feedforward and feedback pathways. Notation defined in the main text.
