Figure 6.
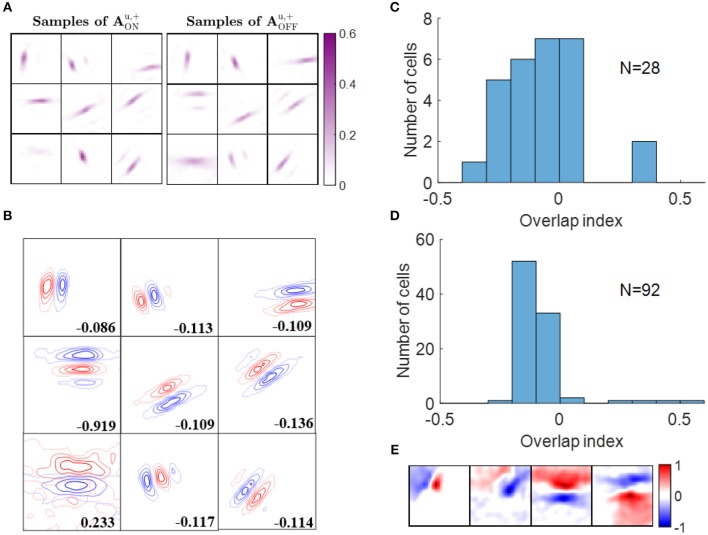
Segregation of ON and OFF sub-regions. (A) Some examples of and . Each block is a 16 × 16 image that represents 256 excitatory connections from ON or OFF LGN cells to a simple cell. The color magenta represents excitatory connections. (B) Red and blue contours represent excitatory connections from ON and OFF LGN cells, respectively. Connections that are smaller than 20% of the maximal connection were removed to only show the substantial weights. The number in each block indicates the overlap index. (C) Histogram of the overlap index for simple cells in cat V1. Re-plotted from Figure 3C in Martinez et al. (2005). (D) Histogram of the overlap index for model simple cells. (E) Synaptic fields of the four simple cells with overlap index larger than 0.1.

