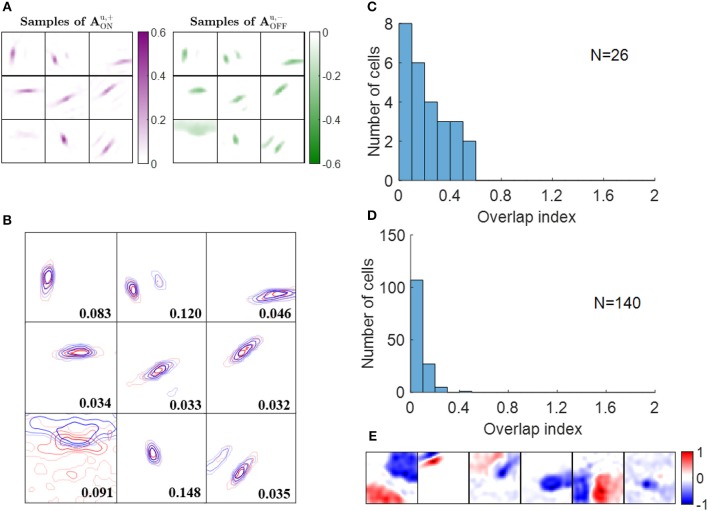
Figure 7.
Push-pull effect. (A) Some examples of and . Each block on the left is a 16 × 16 image that represents 256 excitatory connections from ON LGN cells to a simple cell. Each block on the right represents inhibitory connections from OFF LGN cells to a simple cell. The color magenta represents excitatory connections; the color green represents inhibitory connections. (B) Red and blue contours represent excitatory connections from ON LGN cells () and inhibitory connections from OFF LGN cells (), respectively. Connections that are smaller than 20% of the maximal connection were removed to only show substantial weights. The number in each block indicates the push-pull index. (C) Histogram of the push-pull index for simple cells in cat V1. Re-plotted from Figure 4B in Martinez et al. (2005). (D) Histogram of the push-pull index for model simple cells. (E) Synaptic fields of the six simple cells with push-pull index larger than 0.2.

