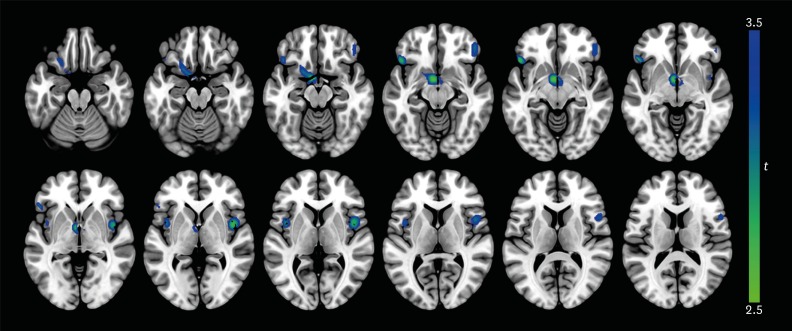
Fig. 1. Differences in regional cerebral blood flow between AD patients with apathy and those without apathy. At each voxel, decreases in brain perfusion in AD patients with apathy appear in blue-green. The height threshold is set at p<0.005 and extent threshold is 100 or more contiguous voxels. Images are shown in neurological convention. Color bar represents voxel-level t-values.
AD: Alzheimer's disease.

