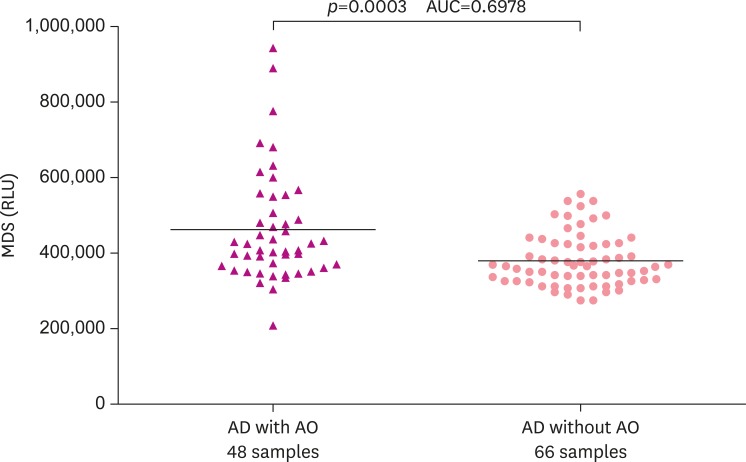
Fig. 3. The distribution pattern of plasma Aβ oligomers determined by the MDS in AD without AO and AD with AO groups. The MDS RLU were higher in the AD with AO than AD without AO group (p<0.0003). The horizontal bar is the median MDS RLU. However, there was overlap between the 2 groups suggesting that further optimization of the MDS is needed.
Aβ: amyloid beta, MDS: Multimer Detection System, AD: Alzheimer's disease, AO: Agent Orange exposure, RLU: relative luminescence units, AUC: area under the curve.

