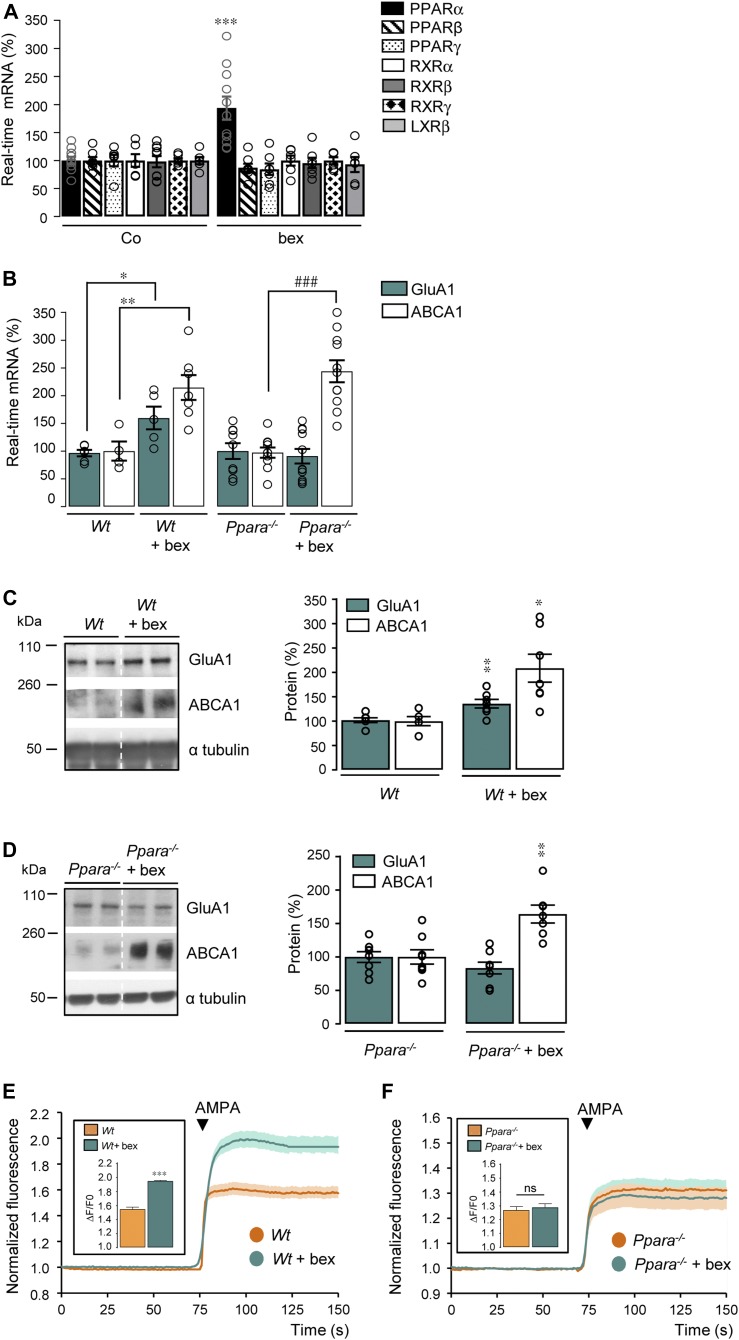
Figure 2. Absence of PPARα abrogates GluA1 expression and AMPA responses induced by RXR activation.
(A) RT-qPCR analyses of Ppara, Pparb, Pparg, Rxra, Rxrg, and Nr1h2 mRNA levels in control (Co) and bexarotene (bex, 100 nM/24 h)-treated cortical cultures (n = 6–10 in 3–5 independent experiments), ***P < 0.001, t test. (B) RT-qPCR analyses of Gria1 and Abca1 mRNA levels in three independent experiments from cortical cells prepared from wild-type (Wt; n = 6 of each) and Ppara-deficient (Ppara−/−; n = 10 of each) mice treated or not with bex. Results are expressed as percentage of corresponding non-treated cells (compared with Wt: *P < 0.05, **P < 0.01; compared with Ppara−/−: ###P < 0.001 [t test]). (C, D) Representative Western blots of cortical cell lysates from Wt (C) and Ppara−/− (D) cultures treated or not with bex. Right panels: GluA1 and ABCA1/α tubulin ratios. Results are expressed as percentage of respective untreated Wt or Ppara−/− (Wt; n = 6, Wt + bex; n = 7, Ppara−/−; n = 8, and Ppara−/− + bex; n = 7 of each analyzed in three independent experiments; *P < 0.05, **P < 0.01, t test, except for ABCA1 in Wt + bex: Mann–Whitney test). (E, F) AMPA-induced calcium fluorescence in Wt (E) and Ppara−/− (F) cortical cells treated with bex. Insets: AMPA responses amplitude (Wt; n = 320, Wt + bex; n = 118, Ppara−/−; n = 430, and Ppara−/− + bex; n = 374 cells analyzed in three to six independent experiments; ***P < 0.001, ns: not significant [P > 0.05], Mann–Whitney test). Data information: data are presented as mean ± SEM.
Source data are available for this figure.

