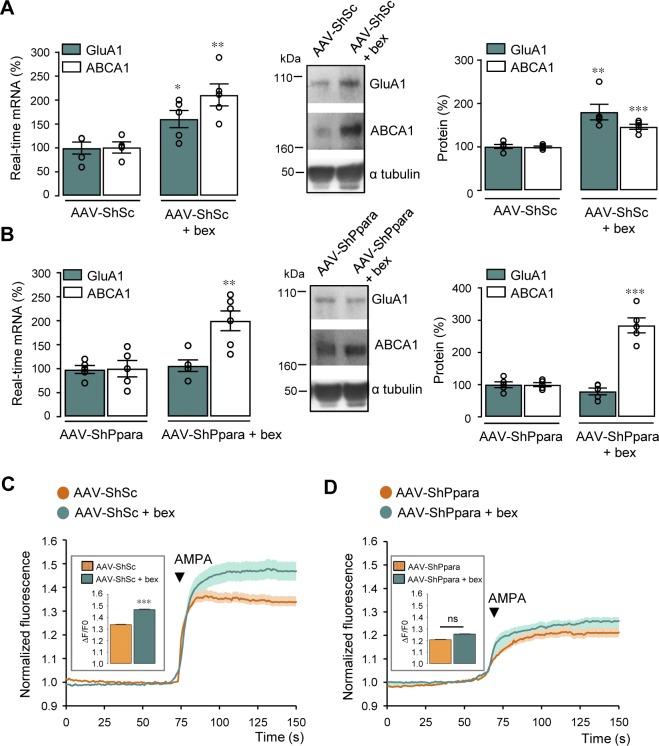
Figure S6. PPARα knockdown abolishes GluA1 up-regulation and AMPA responses induced by RXR activation.
(A, B) Cortical cells transduced with an AAV containing a scramble shRNA (AAV-ShSc) or an shRNA sequence targeting Ppara (AAV-ShPpara). Left panels: RT-qPCR analyses of Gria1 and Abca1 mRNA levels in AAV-ShSc (A) and AAV-ShPpara (B) cells treated with 100 nM bexarotene (bex) for 24 h (n = 5 per condition analyzed in three independent experiments). Results are expressed as percentage of respective untreated cells (in (A) GluA1: *P < 0.05, Mann–Whitney test, ABCA1: **P < 0.01, t test; in (B) GluA1: P > 0.05, ABCA1: **P < 0.01, t test). Middle panels: representative Western blots of cell lysates from AAV-ShSc (A) and AAV-ShPpara (B) cortical cultures treated with bex. Right panels: quantification of GluA1 and ABCA1 levels/α tubulin ratios. Results are expressed as percentage of respective untreated cells (n = 5 per condition analyzed in three independent experiments) (in (A) GluA1: **P < 0.01, Mann–Whitney test, ABCA1: ***P < 0.001, t test; in (B) GluA1: P > 0.05, ABCA1: ***P < 0.001, t test). (C, D) AAV-ShSc (C) and AAV-ShPpara (D) cells treated with bex in the presence of AMPA. Insets: amplitude of AMPA response (in (C) AAV-ShSc; n = 104, AAV-ShSc + bex; n = 125; in (D) AAV-ShPpara; n = 108, AAV-ShPpara + bex; n = 189 cells analyzed in three independent experiments, ***P < 0.001, ns: not significant (P > 0.05), Mann–Whitney test). Data information: data are presented as mean ± SEM.
Source data are available for this figure.

