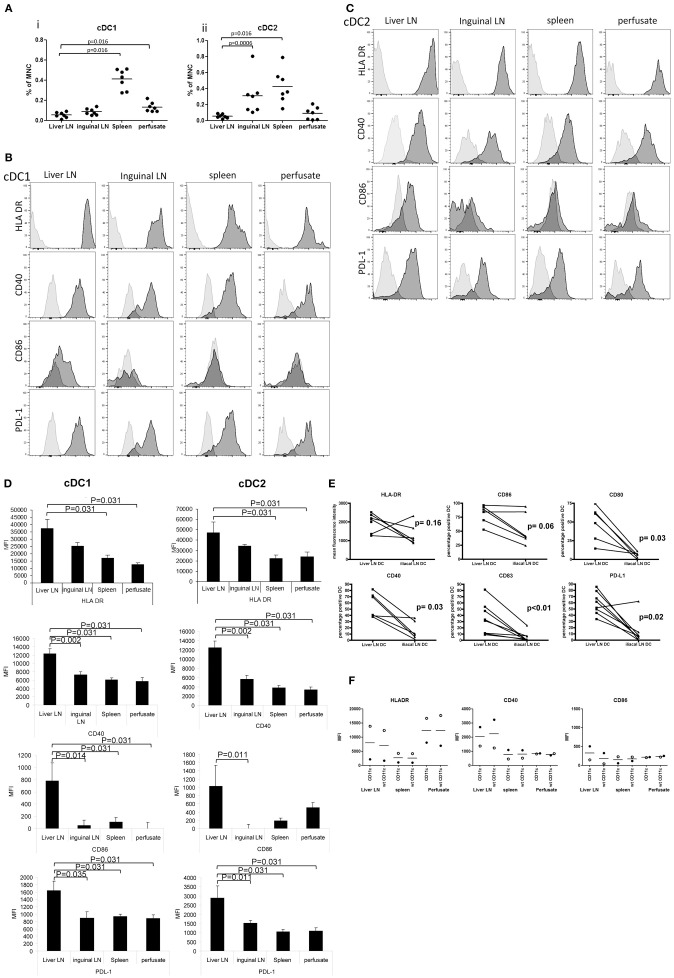
Figure 2.
Relative cDC subset numbers and their maturation status in hepatic and inguinal lymph nodes, spleen and liver. (A) The proportions of lineage−CD141brightcDC1 and lineage−CD11c+CD1c+ cDC1were determined within CD45+ MNC. Dead cells were excluded from the analysis by excluding 7AAD+ cells. Dots represent individual tissues, and lines indicate mean values. Hepatic LN, spleen tissues, and liver perfusates were obtained from the same multi-organ donors, while inguinal LN were collected from kidney transplant recipients. (B) Histograms showing expression of HLA DR, CD40, CD86, and PDL-1 on lineage−CD141brightcDC1 from hepatic lymph nodes, inguinal lymph nodes, spleen, and liver. Light gray histograms are isotype control stains. (C) Histograms showing expression of HLA DR, CD40, CD86, and PDL-1 on lineage−CD1c+cDC2 in hepatic lymph nodes, inguinal lymph nodes, spleen, and liver. Light gray histograms are isotype control stains. (D) Summary of expression levels (MFI) of HLA DR, CD40, CD86, and PDL-1 on lineage−CD141brightcDC1 and lineage−CD1c+cDC2 in liver LN (n = 6) and inguinal lymph nodes (n = 7), spleen (n = 6) and liver (n = 6). Data are depicted as means ± SEM. (E) Expression levels of HLA-DR, CD86, CD80, CD40, CD83, and PDL-1 was determined on cDC2 in MNC isolated from paired liver LN and iliac LN from the same multi-organ donors (n = 6). (F) Comparison of the expression levels of HLA-DR, CD40, and CD86 on cDC2 in tissues of 2 different liver transplant donors gated as lineage−CD11c+CD1c+ (CD11c) cells or as lineage−CD1c+ without inclusion of CD11c in the gating strategy (wt).

