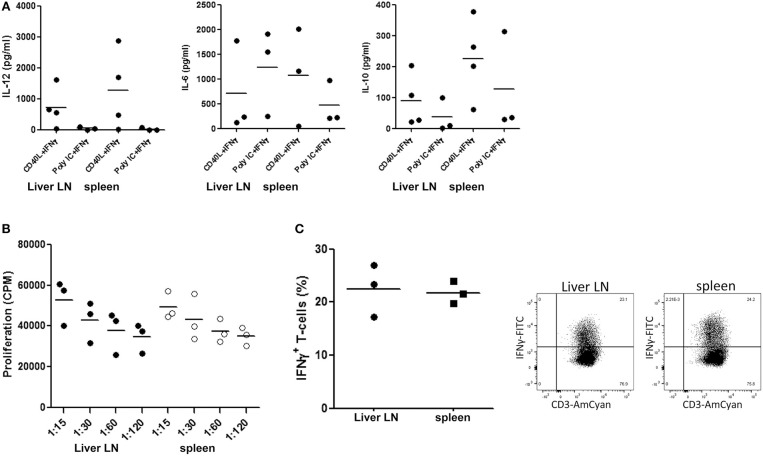
Figure 3.
cDC2 isolated from hepatic lymph nodes and spleen are functionally similar. (A) cDC2 were purified from hepatic LN and spleen MNC from the same donors by immunomagnetic depletion of granulocytes, T cells and B cells followed by flowcytometric sorting of CD1c+CD14−CD20− cells as described in the Methods section, and 2 × 10⁴ cells/200 μl were stimulated with either CD40L-transfected plasmacytoma cells (2 × 10⁴ J558 cells) and 1,000 U/ml IFN-γ, or with 20 μg/ml poly IC and 1,000 U/ml IFN-γ for 24 h at 37°C. After 24 h, supernatants were harvested and levels of IL-12, IL-6 and IL-10 were determined. Dots represent data from individual tissues, and lines indicate mean values. (B) Graded numbers of hepatic LN (solid symbols) and spleen (open symbols) cDC2 from the same donors were co-cultured with graded numbers of allogeneic T cells (from one batch) and T-cell proliferation was assessed after 5 days by [3H]-thymidine incorporation. Dots represent data from individual tissues and lines indicate mean values. (C) Naïve allogeneic CD3+CD45RA+ T cells were co-cultured with cDC2 purified from hepatic LN or spleen from the same donors. After 7 days the T-cells were re-stimulated with PMA and ionomycin for 6 h. For the last 5 h brefeldin A was added. Representative dot plots of intracellular expression of IFN-γ in CD3+ T cells are shown, and a summary of the results from experiments with cDC2 purified from tissues of 3 different donors is depicted. Dots represent data from individual tissues and lines indicate mean values.

