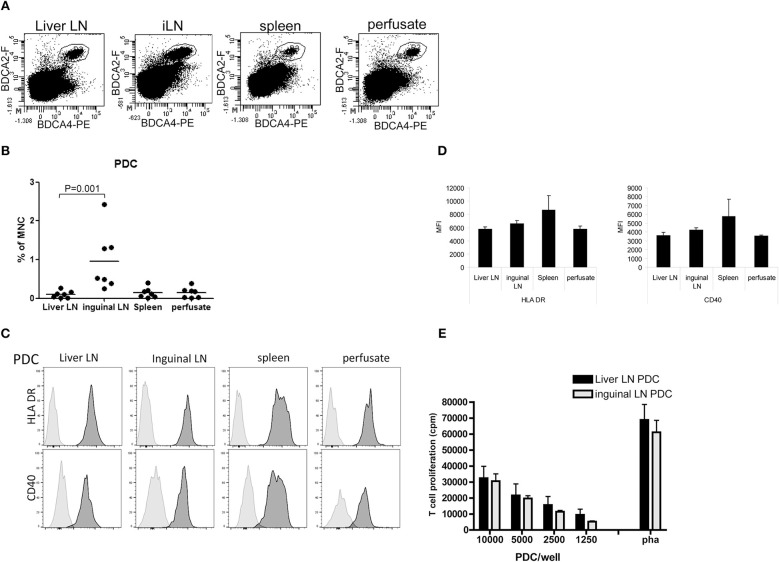
Figure 4.
PDC in hepatic and inguinal lymph nodes, spleen and liver. (A) Flowcytometric determination of PDC in MNC isolated from hepatic and inguinal lymph nodes, spleen, and liver perfusate using anti-BDCA2 and anti-BDCA4 antibodies. Non-hematopoietic cells and dead cells were excluded from the analysis by exclusion of CD45− cells and 7-AAD+ cells. (B) Percentages of BDCA2+BDCA4+ PDC within MNC in the different tissues. Dots represent data from individual tissues and lines indicate mean values. (C) Histograms showing HLA-DR and CD40 expression on PDC from the different tissues. Light gray histograms are isotype control stains. (D) Summary of the expression levels of HLA-DR and CD40 on PDC in hepatic (H) lymph nodes (n = 6) and inguinal lymph nodes (n = 7), spleen (n = 6), and liver (n = 6). Data are depicted as means with SEM. No significant differences were observed (E) Graded numbers of purified hepatic (n = 6) and inguinal LN PDC (n = 5) were co-cultured with allogeneic T-cells (from one batch) and T-cell proliferation was assessed after 5 days by [3H]-thymidine incorporation. T-cell proliferation in response to PHA is depicted as positive control condition. Data represent means with SEM. No significant differences were observed.

