Figure 5.
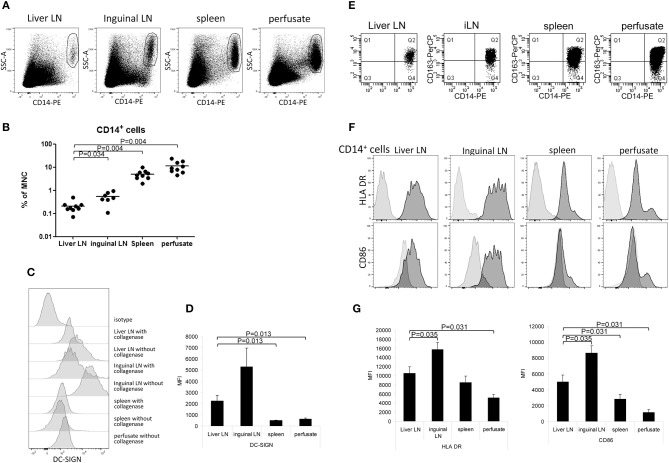
Relative CD14+ cell numbers and their activation status in hepatic and inguinal lymph nodes, spleen, and liver. (A) CD14+ cells were determined within vital CD45− MNC. Representative dot plots are shown. (B) A summary of the percentages of CD14+ cells within vital CD45− MNC isolated from the different tissues. Data from individual tissues are depicted as dots and lines indicate mean values on a log-scale. (C) DC-SIGN-expression on CD14+ cells that were isolated from tissues with collagenase or without collagenase treatment. Tissues were divided into two parts, and after cutting into small pieces, one part was treated with collagenase and the other part not. After that, single cell suspensions were made from both parts. (D) Summary showing DC-SIGN expression levels on CD14+ cells from liver lymph nodes (n = 6) and inguinal lymph nodes (n = 7), spleen (n = 6), and liver (n = 6). Except for liver, MNC were isolated from the tissues using collagenase. Data are depicted as means with SEM. (E) CD163 expression on CD14+ cells in MNC from liver LN, inguinal LN, spleen and liver perfusate. (F) Histograms showing HLA-DR and CD86 expression on CD14+ cells in the different tissues. Light gray histograms are isotype control stains. (G) Summary of HLA-DR and CD86 expression levels on CD14+ cells in liver lymph nodes (n = 6), inguinal lymph nodes (n = 7), spleen (n = 6), and liver (n = 6). Data are depicted as means with SEM.

