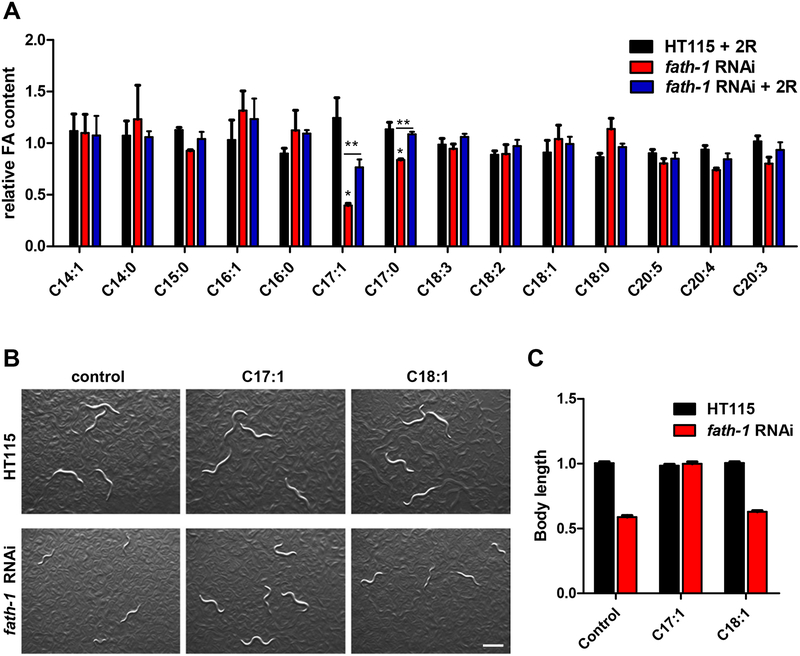
Figure 6. Δ10C17:1 mediates FATH-1 function in growth and development.
(A) Relative FA abundance normalized to HT115 control group. (three biological replicates, N >1000/condition). Error bars, ± SEM; *p<0.05, **p<0.01. (B) Bright-field images of worms fed with HT115 control or fath-1 RNAi treated with BSA, Δ10C17:1 or Δ9C18:1. Scale bar, 400 μm. (C) Body length measurement of worms fed with HT115 control or fath-1 RNAi treated with BSA, Δ10C17:1 or Δ9C18:1. N≥ 51 for each data set.

