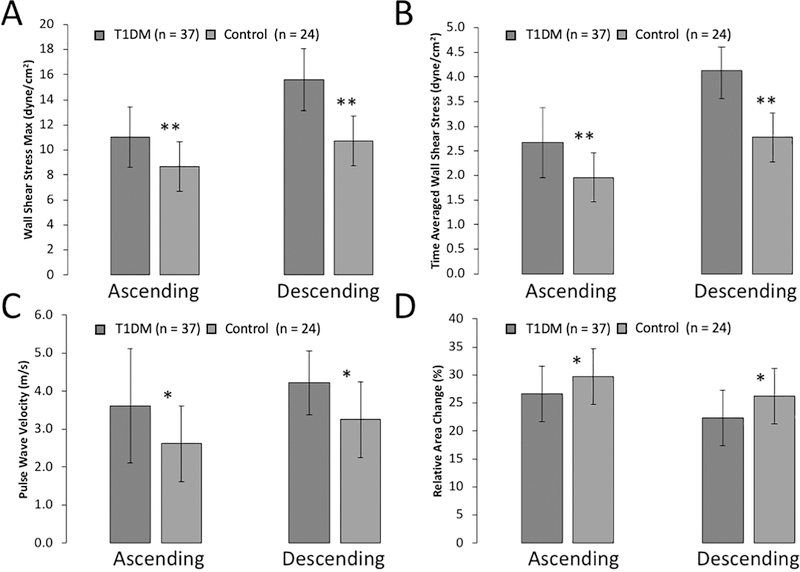
Figure 1A-D: Phase-Contrast MRI Reveals Abnormal Aortic Function in T1D Youth vs. Controls.
Figure 1. Limited to participants who had phase-contrast MRI data at baseline. Phase-contrast derived MRI measures of the ascending and descending aorta are shown, including: (A) Maximal systolic wall shear stress; (B) Time-averaged wall shear stress; (C) Pulse wave velocity; (D) Relative area change (aortic distensibility). All data sets were adjusted for age, sex, and BMI percentile. *p < 0.05; †p < 0.001

