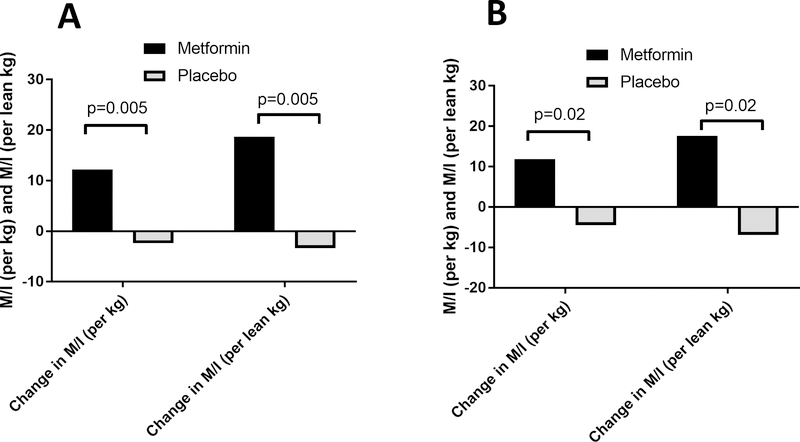
Figure 3A and 3B: Metformin Improves Insulin Sensitivity in Adolescents with Type 1 Diabetes.
Figure 3A. Change in M/I (per kg) in response to metformin vs. placebo, in all T1D participants, adjusted for baseline M/I (per kg) and change in M/I (per lean kg) in response to metformin vs. placebo in all T1D participants, adjusted for baseline M/I (per lean kg)
Figure 3B. Change in M/I (per kg) and M/I (per lean kg) in response to metformin vs. placebo in n=28 T1D youth with BMI <90th %ile, adjusted for baseline M/I (per kg) or baseline M/I (per lean kg)

