
Figure 3.
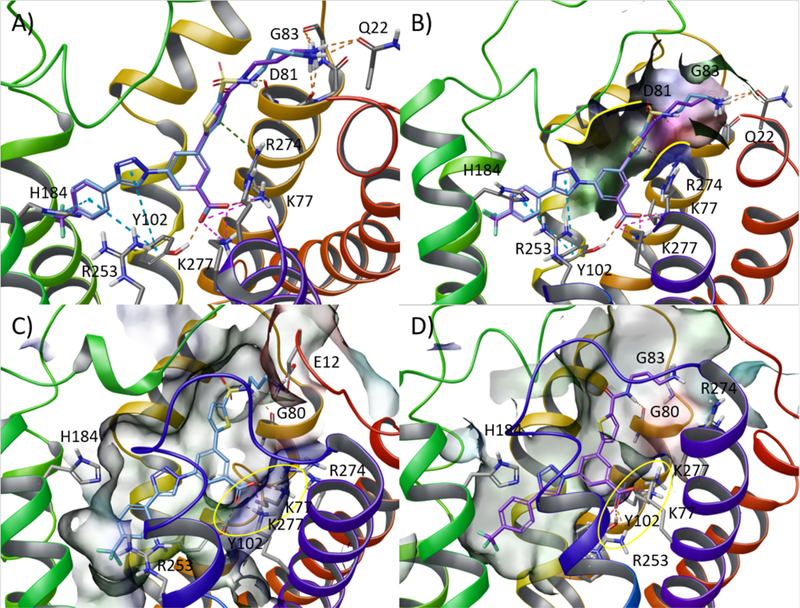
Selection of the optimal linker geometry: alkyl sulfonamide vs amide. Upper panel: docking analysis. (A) Superimposition of docking poses of sulfonamide derivative 7 (light blue carbon atoms) and amide derivative 20 (purple carbon atom) representing the starting geometry for subsequent MD simulations. (B) Detail of the shape (highlighted with a solid yellow line) of the narrow pocket surrounding the thiophene ring delimited by the conserved disulfide bridge and the EC tip of TM2 of the hP2Y14R. Lower panel: lowest interaction energy (IE) structure extracted from the selected trajectory of 30 ns of MD simulation of the (C) 7-hP2Y14R and (D) 20-hP2Y14R complexes. Side chains of residues important for ligand recognition are reported as sticks (grey carbon atoms). H-bonds and salt bridges are pictured as orange and magenta dashed lines, respectively. Nonpolar hydrogen atoms and π-π stacking interactions are omitted. The binding site surface is color-coded by residue property (blue: positively charged, red: negatively charged, green: hydrophobic, cyan: polar). The interaction pattern around the carboxylate moiety is highlighted with a yellow circle.