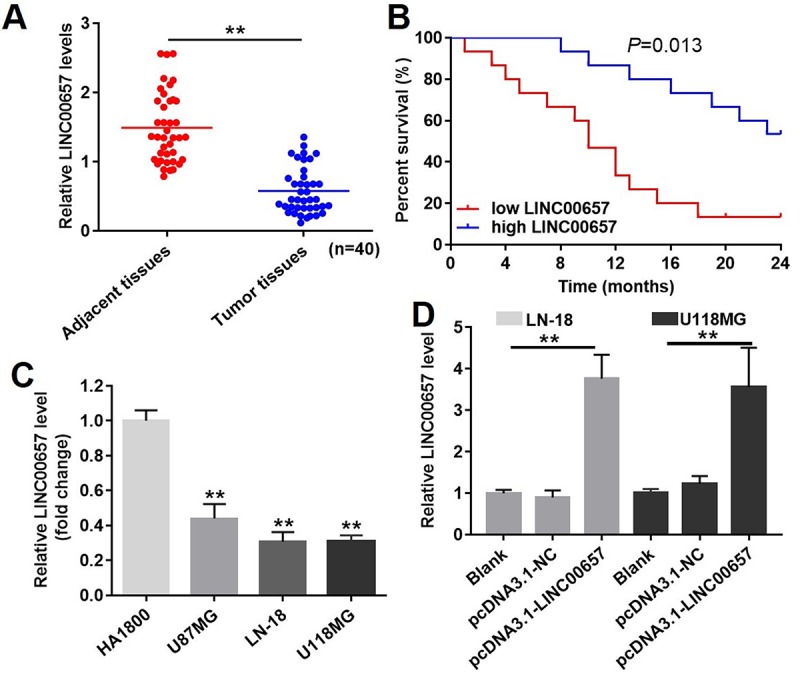
Figure 3.

The expression of LINC00657 in patients with GBM and in GBM cell lines. (A) Relative expression of LINC00657 in normal tissues (adjacent tissues of GBM patients) and tumor tissues of GBM patients (n = 40). **P<0.01, paired t-tests. (B) The survival curve of GBM patients with low or high LINC00657. **P=0.013, compared with low LINC00657 group, log-rank test. (C) Relative expression of LINC00657 in four kinds of cells including HA1800, U-87MG, LN-18 and U-118MG. **P<0.01, compared with HA1800 group, unpaired t-tests. (D) Relative expression of LINC00657 in LN-18 and U-118MG cells after transfecting with pcDNA3.1-NC and pcDNA3.1-LINC00657. Relative expression of LINC00657 was detected using RT-qPCR. GAPHD was chosen to be the internal standard. The mean value of the relative expression of LINC00657 was used as the divide of low and high level of LINC00657. **P<0.01, ANOVA analysis.
