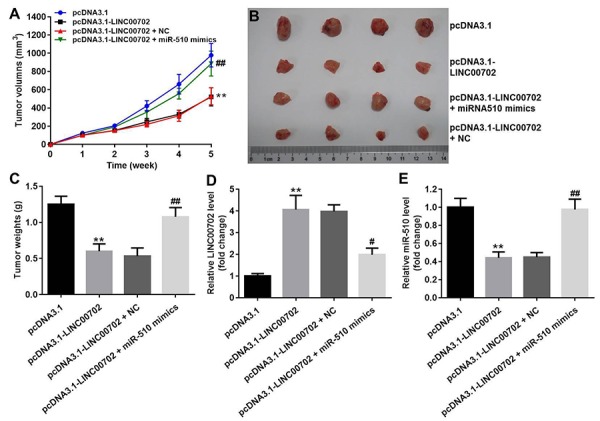
Figure 7.

Effects of LINC00702 on the NSCLC tumor growth in vivo. (A) Tumor volumes in each group were monitored weekly using caliper. (B) Representative image of the tumors from xenografted mice. (C) Quantitative analysis of tumor weights isolated from mice. (D) Quantitative RT-PCR analysis of LINC00702 level in tumor tissues. (E) Quantitative RT-PCR analysis of miR-510 level in tumor tissues. **P<0.01 were considered to indicate a statistically significant difference versus the pcDNA3.1-group. #P<0.05, ##P<0.01 were considered to indicate a statistically significant difference versus the pcDNA3.1-LINC00702 group.
